Chapter 4: The Quality Check (FastQC)
Learning Objectives
- Retrieve raw sequencing data directly from public repositories (ENCODE) using command-line tools.
- Create a reproducible "digital aliquot" (subset) of data using
seqtkto test your pipeline efficiently. - Execute the FastQC tool to generate quality assessment reports.
- Interpret the basic structure of a FastQC report to decide if data is suitable for downstream analysis.
Introduction: The "Digital Nanodrop"
Imagine you just received a box of dry ice from a sequencing facility. Inside are tubes of DNA. Before you use that DNA for a crucial, expensive experiment, what is the first thing you do?
You run it on a Nanodrop or a Bioanalyzer. You need to know: Is the DNA degraded? Is there contamination? Is the concentration what they promised?
In computational biology, we have the exact same problem. You have just received a file containing millions of sequencing reads (a FASTQ file). Before you spend days trying to map these reads to a genome, you must verify that the sequencing run actually worked.
To do this, we use a tool called FastQC. It is the standard "Bioanalyzer" of the bioinformatics world.
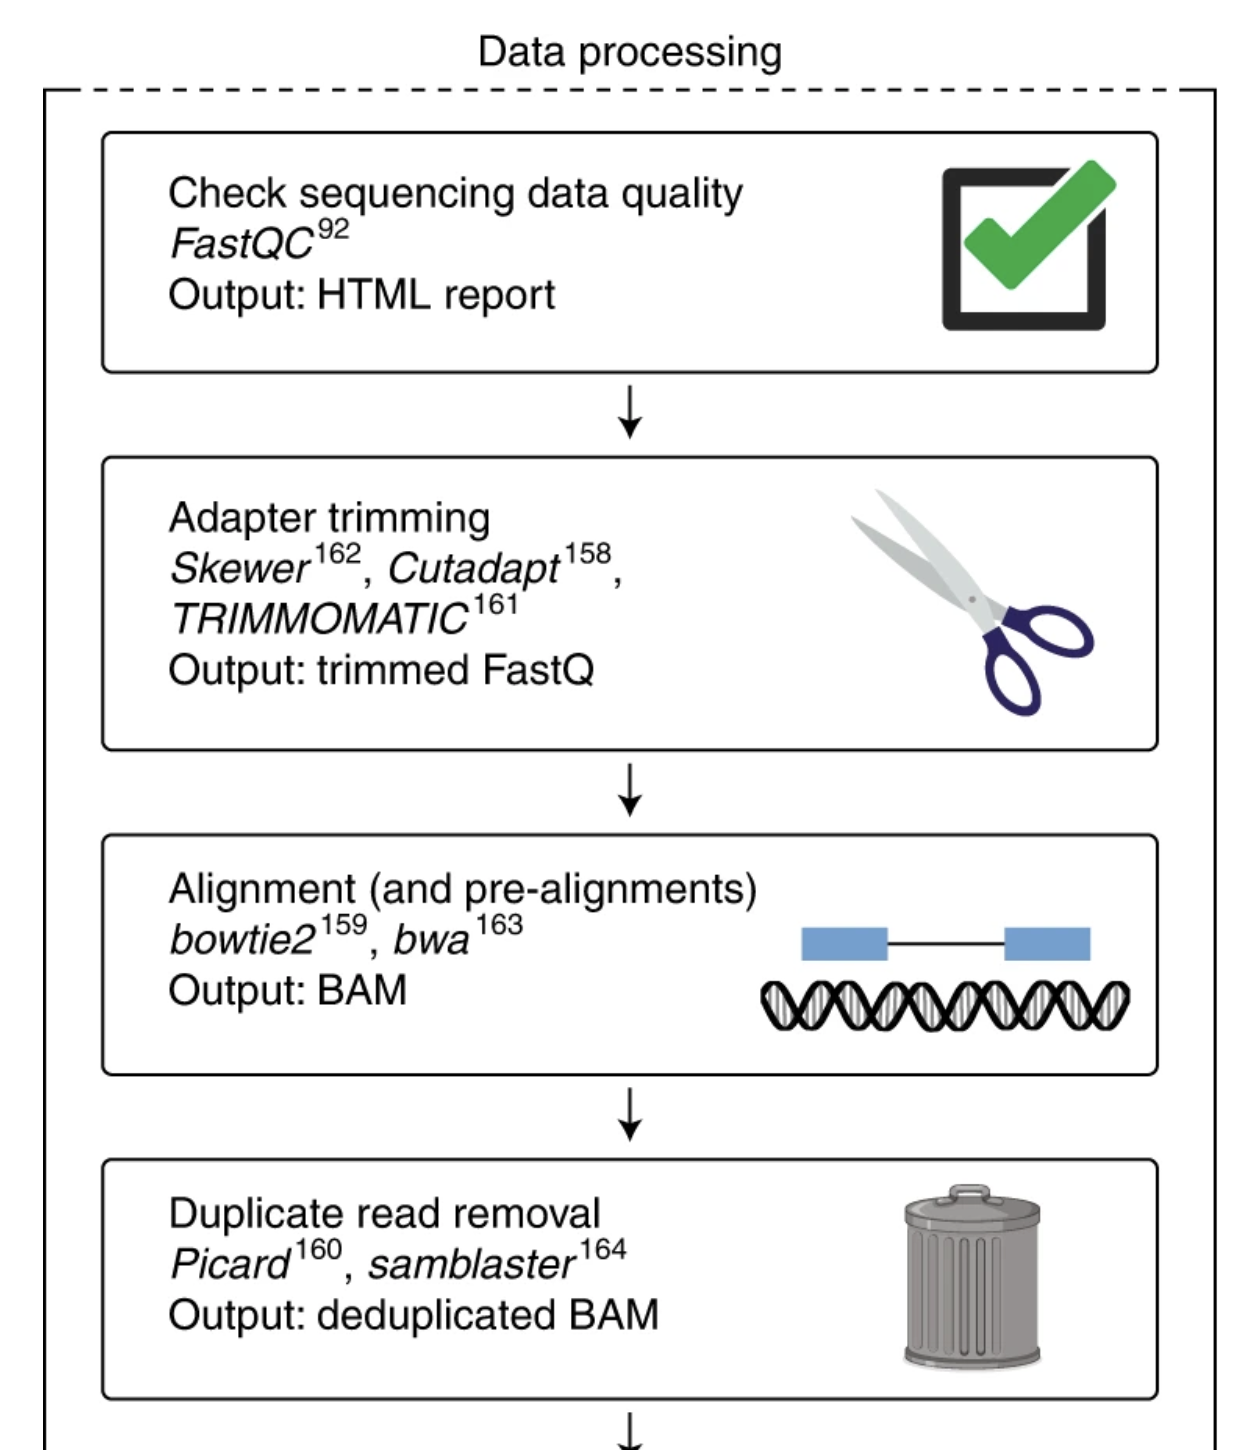
Figure: Typical sequencing data processing pipeline. FastQC quality assessment (Step 1) must be performed before any downstream analysis. The results guide decisions about adapter trimming, quality filtering, and help identify potential issues that could affect alignment and quantification steps.
Part 1: Entering the Lab
First, we need to make sure we are wearing our lab coat. In Chapter 3, we created a specific environment called bio-tools where we installed our software. We need to put that coat on now.
Open your terminal and run:
conda activate bio-tools
Check: Does your prompt start with (bio-tools)? If yes, you are ready.
Now, walk to the "freezer" where we decided to store our raw samples (Chapter 2).
cd ~/atacseq/raw_data
Part 2: Retrieving the Sample
For this handbook, we won't make you sequence your own DNA. We will use a high-quality public dataset from ENCODE (The Encyclopedia of DNA Elements).
The Biological Context:
- We are downloading an ATAC-seq dataset from a Mouse Monocyte (immune cell).
- Why Mouse? To avoid the ethical and privacy complexities of handling Human genomic data for a tutorial.
- Why Monocytes? Immune cells have very dynamic chromatin. ATAC-seq is perfect for seeing which genes are "open" and active in these cells.
We will use a tool called wget (Web Get). Think of wget as a digital courier service. You give it an address (URL), and it goes out to the internet and brings the package back to your current folder.
Run this command:
wget https://www.encodeproject.org/files/ENCFF535OGL/@@download/ENCFF535OGL.fastq.gz
What is happening? You will see a progress bar filling up. You are downloading a compressed file (.gz stands for gzip, like a .zip file). Once it finishes, type ls -lh. You should see the file ENCFF535OGL.fastq.gz sitting in your folder.
Part 3: Creating a "Digital Aliquot" (Subsampling)
The file you just downloaded is large. Running a test on the whole thing might take 10-20 minutes. When you are building a pipeline or learning, you don't want to wait that long just to see if your code works.
In the wet lab, you wouldn't use your entire stock of antibody for a test run. You would take a small aliquot.
We will do the same using a tool called seqtk. We will randomly grab 1 million reads to play with.
The Command (Run this carefully):
seqtk sample -s 100 ENCFF535OGL.fastq.gz 1000000 | gzip > ENCFF535OGL_subset.fastq.gz
Breaking down the "Pipeline" logic:
seqtk sample: "Hey seqtk, I want to sample some reads."-s 100: The Seed. By setting this to 100, we ensure reproducible sampling.ENCFF...: The input file we are reading from.1000000: We want exactly one million reads.|(Pipe): Takes the output ofseqtkand sends it into the next command.gzip: Compresses the reads immediately to save space.>(Redirect): Saves the final compressed data intoENCFF535OGL_subset.fastq.gz.
You now have two files: the big original one, and your small, light, easy-to-use subset.
Part 4: Running the Quality Check
Now we have our aliquot. It's time to run the Bioanalyzer (FastQC). We want the results to go into our organized results/fastqc folder, not clutter up our raw_data folder.
Run the QC:
fastqc ENCFF535OGL_subset.fastq.gz -o ../results/fastqc/
The Output:
Analysis complete for ENCFF535OGL_subset.fastq.gz
Part 5: Viewing the Report
FastQC doesn't print the results to the terminal. It generates a visual HTML report, just like a website.
Let's move into the results folder to find it:
cd ../results/fastqc/

ls
You will see two files: a .zip file (the raw data) and an .html file (the report).
Opening the file:
- On macOS:
open ENCFF535OGL_subset_fastqc.html - On Linux:
xdg-open ENCFF535OGL_subset_fastqc.html
How to Read the "Traffic Lights"
When the report opens in your browser, you will see a list of modules on the left, marked with Green Checks (Pass), Orange Exclamation Marks (Warning), or Red Xs (Fail).
Do not panic if you see Red. In wet lab terms, a "Fail" here is like a pH meter beeping. It doesn't always mean the sample is trash; it just means it looks different than a standard genomic DNA library.
Since this is high-quality ENCODE data, you should mostly see Green Checks. You might see a warning in "Sequence Duplication" or "Base Sequence Content"—this is often an artifact of the ATAC-seq biology (the Tn5 bias) rather than a technical failure.
Troubleshooting
wgetcommand not found: You might have skipped installing it. Runconda install wgetinside your environment.seqtkcommand not found: Ensure you actually ranconda activate bio-tools.- "Directory does not exist": Check your spelling. Remember,
cd ..moves you UP one level. Usepwdto check where you are.
Next Step
You have successfully generated your first quality control report. However, seeing a "Red X" or a "Warning" flag can be alarming if you don't know the context. As we mentioned, ATAC-seq data often looks "wrong" to standard QC tools because of its unique biology. In Chapter 5, we will dissect every plot in the FastQC report to learn how to distinguish between a failed experiment and expected biological artifacts.